Use the video controls above, or download the MP4 to watch the film.
Read the film transcript
Pollution can move downstream before communities receive a warning. Yet monitoring is disconnected, information is scattered, and pollution sources are poorly understood.
The Lao Water Quality Innovation Strategy brings fragmented projects and investment under one framework.
A shared data hub and pollution source map connect the information.
Satellites, community testing and river stations detect changes. Modern laboratories and mobile lab trucks bring reliable testing closer to communities.
Pollution forecasts show where threats could travel. Dashboards and mobile alerts inform the public, while a wastewater compliance system helps agencies track corrective action.
Community treatment and local membrane production build lasting protection.
Deploy in 2027. Connect in 2028. Sustain in 2029.
Fourteen practical deliverables. One integrated water quality intelligence system—uniting agencies, development partners and investment around measurable results.
From early detection to action.
THE INTELLIGENCE-TO-ACTION CYCLE
RESULT-BASED. TANGIBLE. DEPLOYMENT-DRIVEN.
Make a choice. Change a variable. See what happens. Every stage has something to explore.
INTERACTIVE CONCEPT
All demo data, locations and outcomes below are illustrative. These prototypes do not provide live monitoring, validated forecasts or public alerts.
0 / 7 explored
◎01 / DIRECT
Know what matters most
DIRECT
Identify priority contaminants, vulnerable communities, strategic water sources and capability gaps. Stocktake all development partners’ bilateral water-quality support and harmonize projects, agencies and investments under one National Water Quality Innovation Strategy to reduce fragmentation and redundant support.
1 national deliverable+
DELIVERABLE #1
National Water Quality Innovation Strategy
National priorities, a development partner support stocktake, shared delivery responsibilities and a results-based deployment roadmap. Align bilateral support under the same framework to fill gaps, reduce redundancy and achieve measurable outcomes.
DELIVERABLE #1 / NATIONAL STRATEGY2027–2029
One framework. Collective delivery.
Stocktake development partners’ bilateral support, harmonize projects and reduce redundant investment under one strategy. Deploy from 2027 and sustain collective results through 2029.
2027 → 2029
Three years of deployment
DeployConnectSustain
DIRECT · 31 MARCH 2027One strategy for collective delivery
Strategy accepted with the partner-support stocktake, shared priorities, responsibilities and deployment plan.
Real geographic reference · Demonstration source data · Natural Earth
◉03 / DETECT
Spot emerging threats early
DETECT
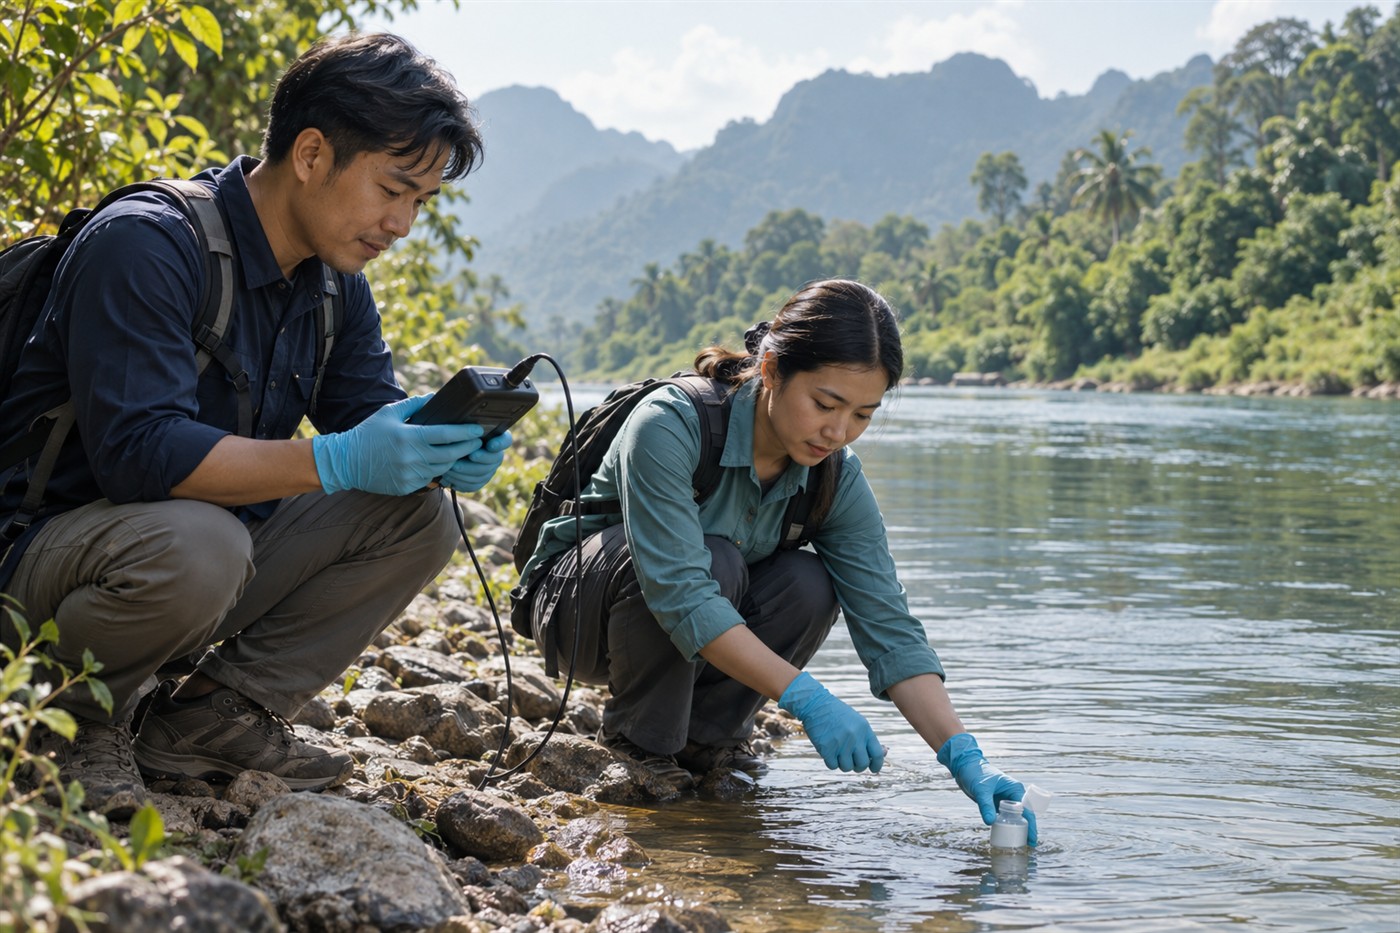
Combine observations from space, river monitoring and community testing to identify changes that need investigation. These complementary approaches flag potential problems for verification.
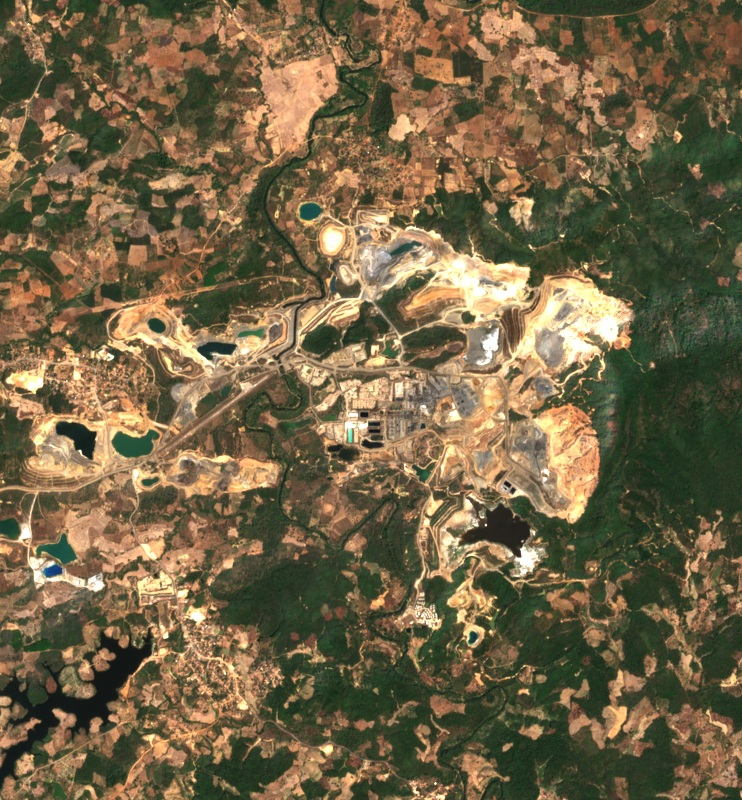
Archived Sentinel-2 image · Illustrative review zones, not AI detections. Contains modified Copernicus Sentinel data (2025), processed by Element 84. Image source.
◇04 / VERIFY
Increase Data Collection Coverage
VERIFY
Investigate flagged locations, collect samples and establish the type, concentration and extent of contamination. Check suspected activities against permit records.
2 national deliverables+
DELIVERABLE #7
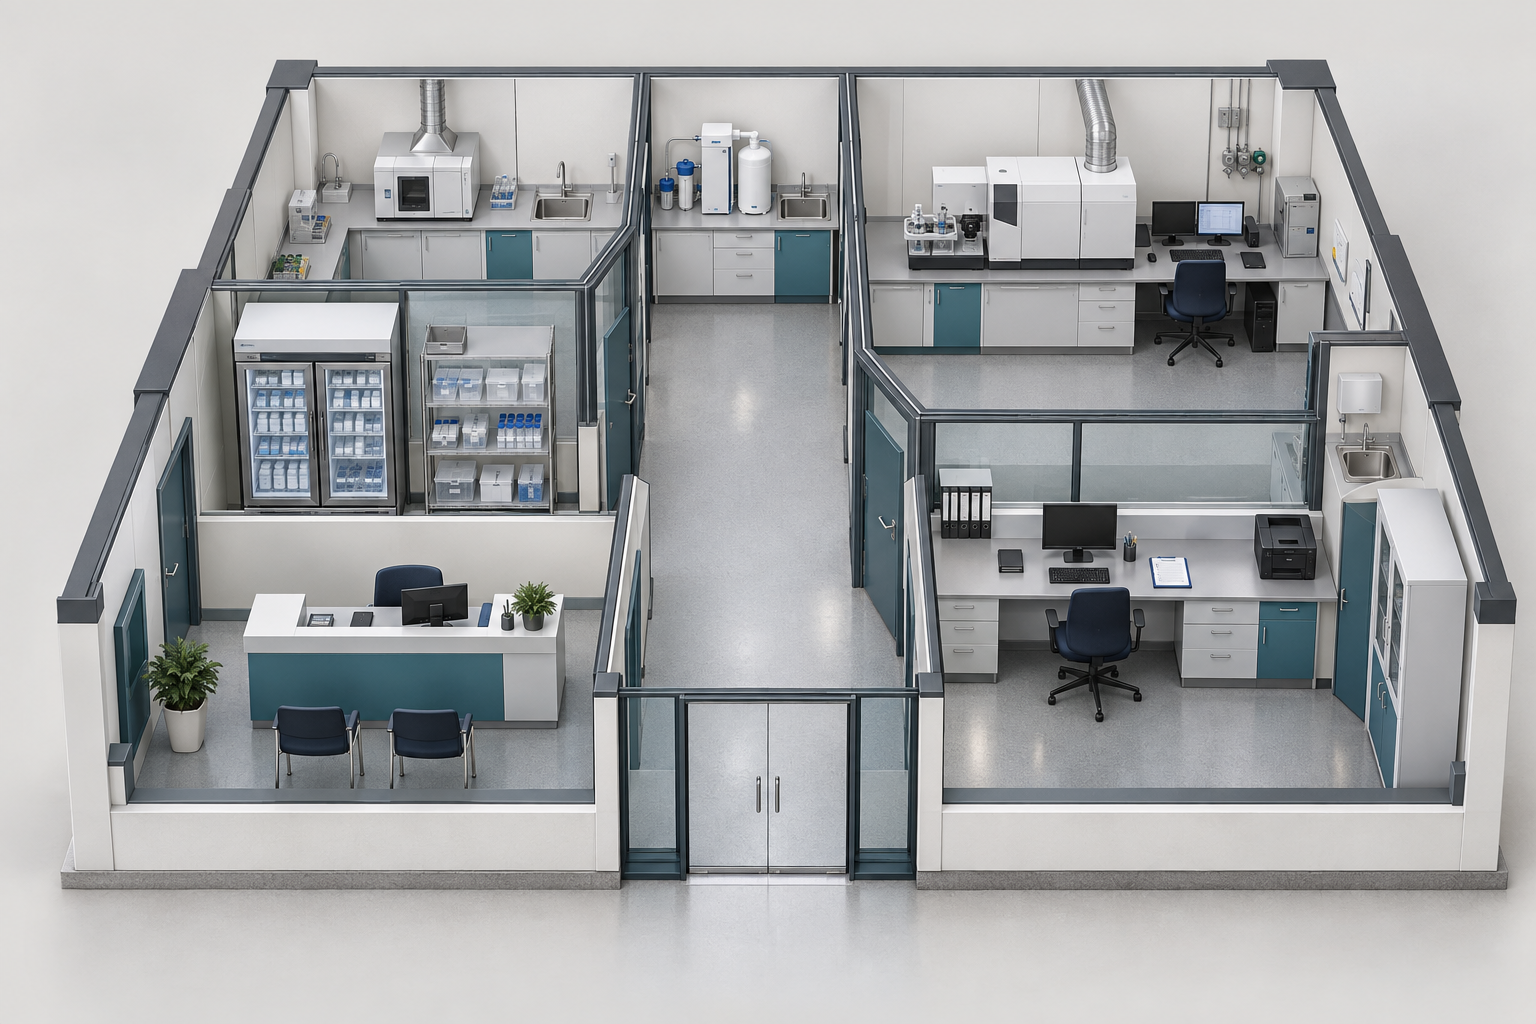
Strengthened Lao water laboratories
People, equipment and procedures to confirm what is happening.
DELIVERABLE #8
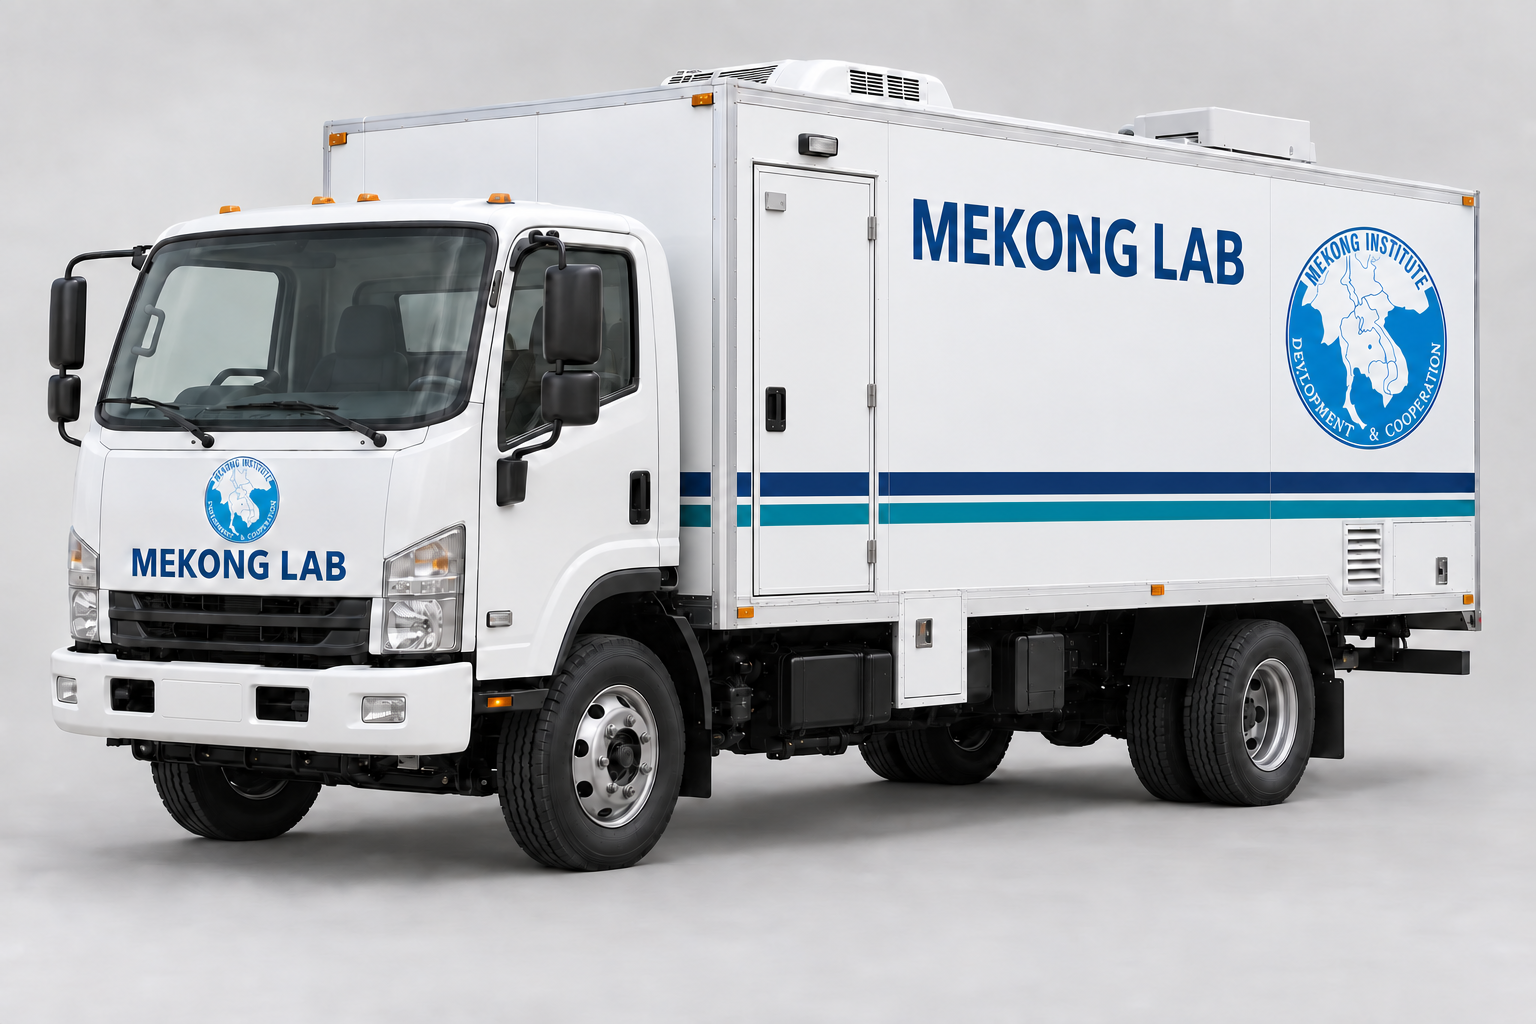
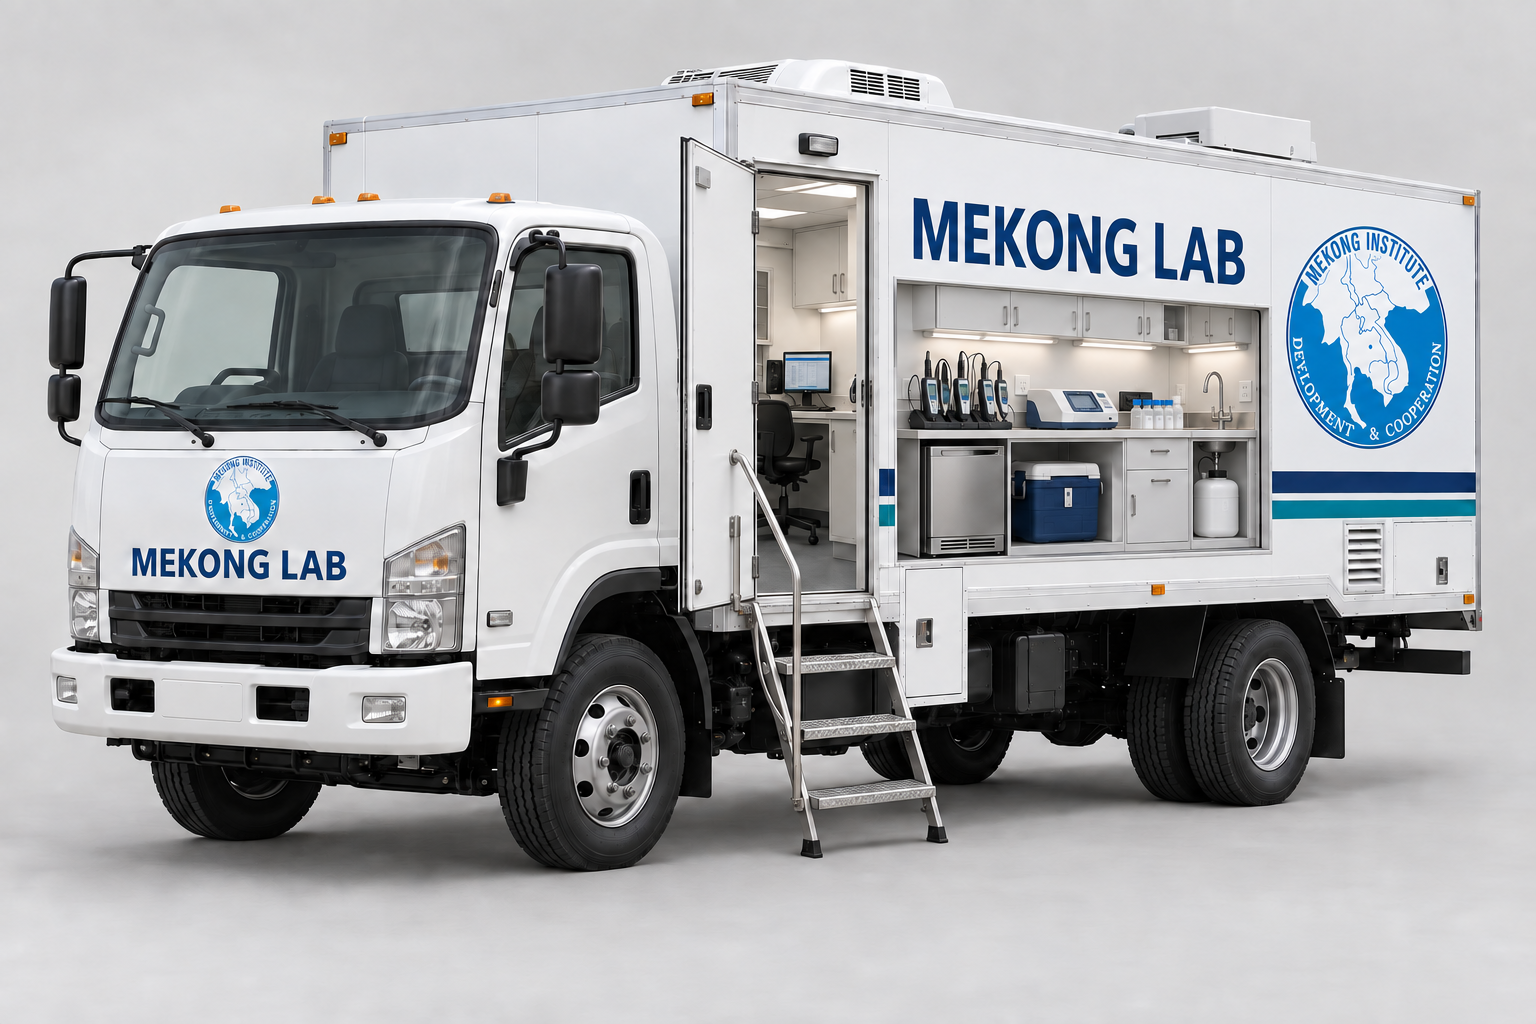
Mobile Lab water quality truck field fleet
Mobile laboratory trucks extend field investigation and testing outreach to communities.
04 / VERIFY
Step inside the science.
Interactive concept
Explore a modern water laboratory, then open the mobile lab truck to see what travels into the field.
Click the truck or its door to step inside.
Illustrative 3D designs and proposed equipment. Fixed laboratories confirm heavy metals; the mobile lab supports field screening and sample handling. Equipment, fleet size and final engineering remain subject to the agreed scope.
Use verified observations and river-flow information to estimate where pollution could travel, when it might arrive and which water intakes or communities could be exposed.
1 national deliverable+
DELIVERABLE #9
Pollution Simulation and Forecasting Engine
Connect the data hub, monitoring network and AI capability to deliver downstream forecasts and exposure scenarios.
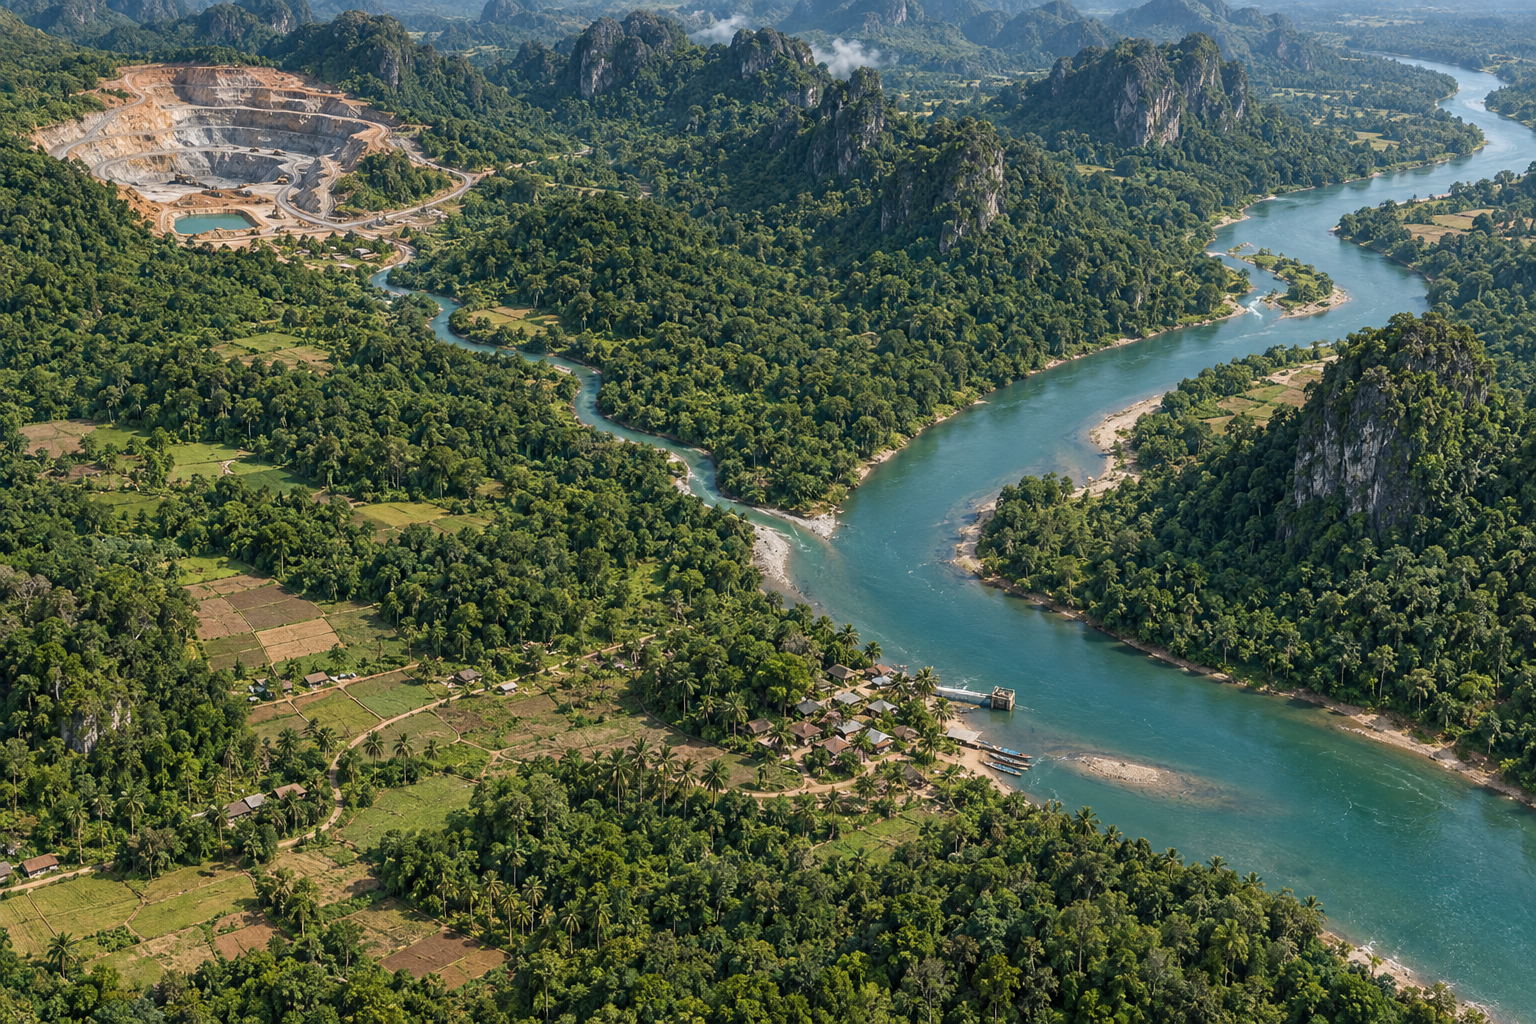
Play a mining-release scenario. Follow the plume through a tributary, into the main river and past downstream water users.
MINING → TRIBUTARY → MAINSTREAM00h 00m
Mine release0 km
Cu concentration overlayLow High
Press play to follow the release ↑
Release · 0 h12 h24 h36 h
Plume centre0.0 km
Leading display edge0.0 km
Mass still in reach0.0 kg
Ready · 20 kg release over 2 hours. Press play or move the timeline.
CONCENTRATION ALONG THE RIVER
µg/L · The scale stays fixed while the scenario plays. The drop at 18 km reflects mixing with the larger river.
Released 0.0 kgIn reach 0.0 kgBeyond 60 km 0.0 kg
Scenario assumptions & how to read this animation +
The model represents downstream advection, longitudinal dispersion and complete mixing at the confluence. It uses steady flows and an initially uncontaminated river. A coarse 200 m grid adds numerical spreading; timing is illustrative, not a precision forecast. It tracks the selected metal as a conservative dissolved tracer: no decay, sorption, settling, resuspension, pH chemistry or uptake into organisms. Different metals share the same transport calculation; their health context differs.
Arrival and the displayed plume edge use a 0.1 µg/L visualization threshold, not a health, drinking-water or regulatory limit. “Below display level” does not mean safe. Distances belong to the 60 km scenario; the illustrated landscape is not a surveyed map. The color is an explanatory overlay—dissolved metals are not necessarily visible.
This is a simplified educational model, not a calibrated Mekong forecast or a fish mortality, fish-tissue or human-health model. At 1× playback, one real second represents 24 simulated minutes. Field observations and independent validation are needed for operational use. EPA transport modelling context ↗
Illustrative mining release, landscape, flows and concentrations. No real mine, community, fishery or pollution incident is identified. Potential health effects depend on exposure and local conditions.
Demonstration alerts and locations. No notifications are sent.
◈07 / PROTECT
Deliver lasting community protection
PROTECT
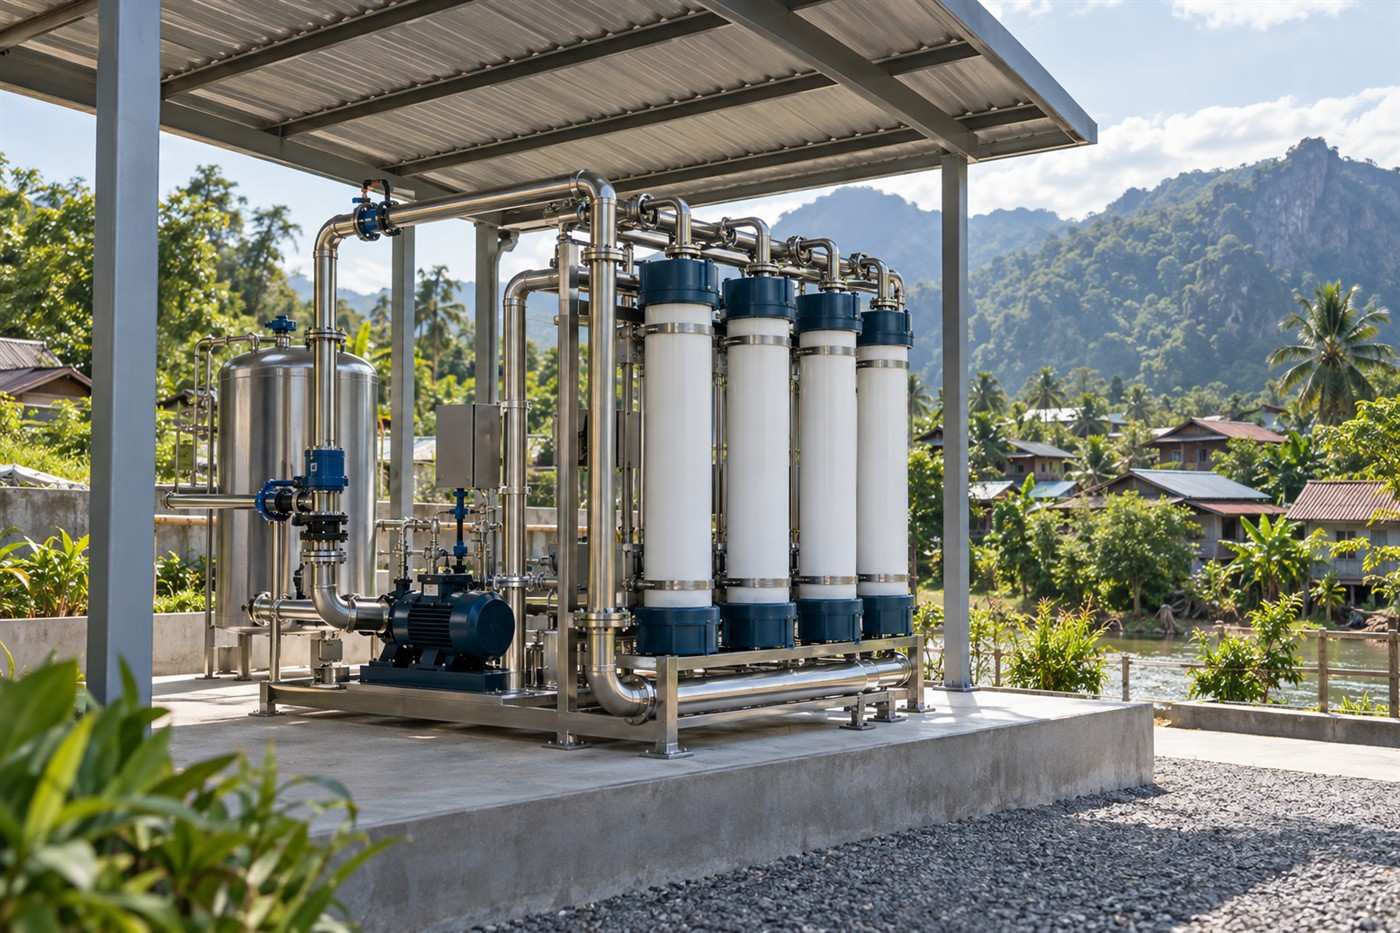
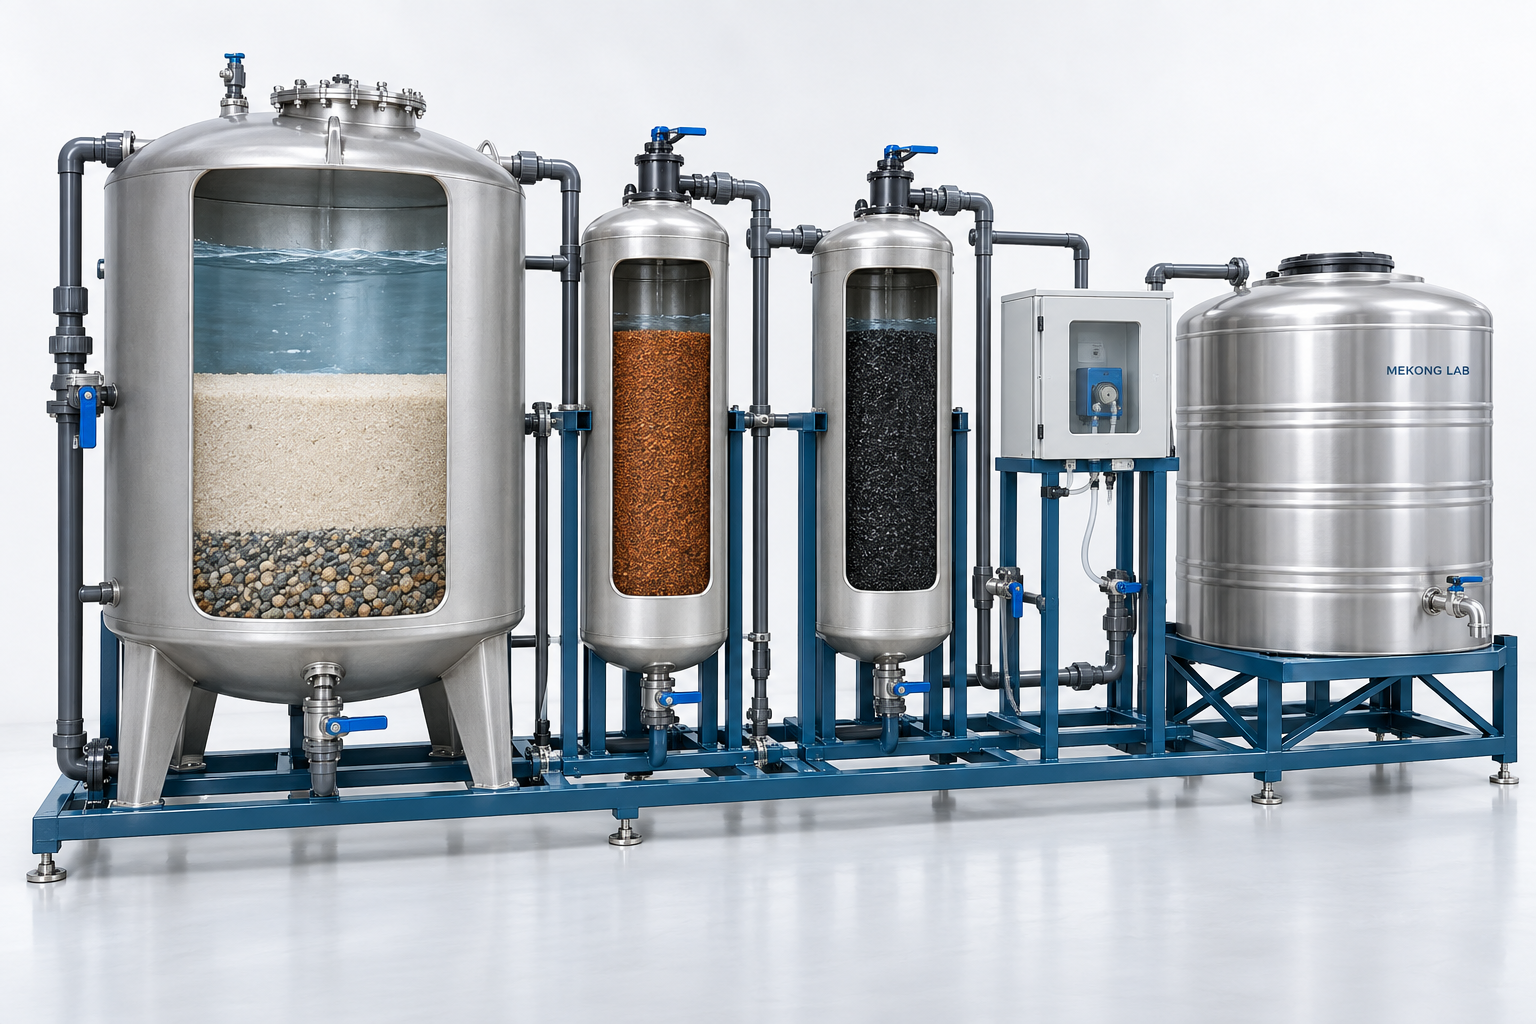
Where water-source assessments demonstrate a treatment need, develop suitable community systems and the local capability to operate, maintain and supply them. Verify that interventions improve water quality.
2 national deliverables+
DELIVERABLE #13
Community water treatment research and demonstration programme
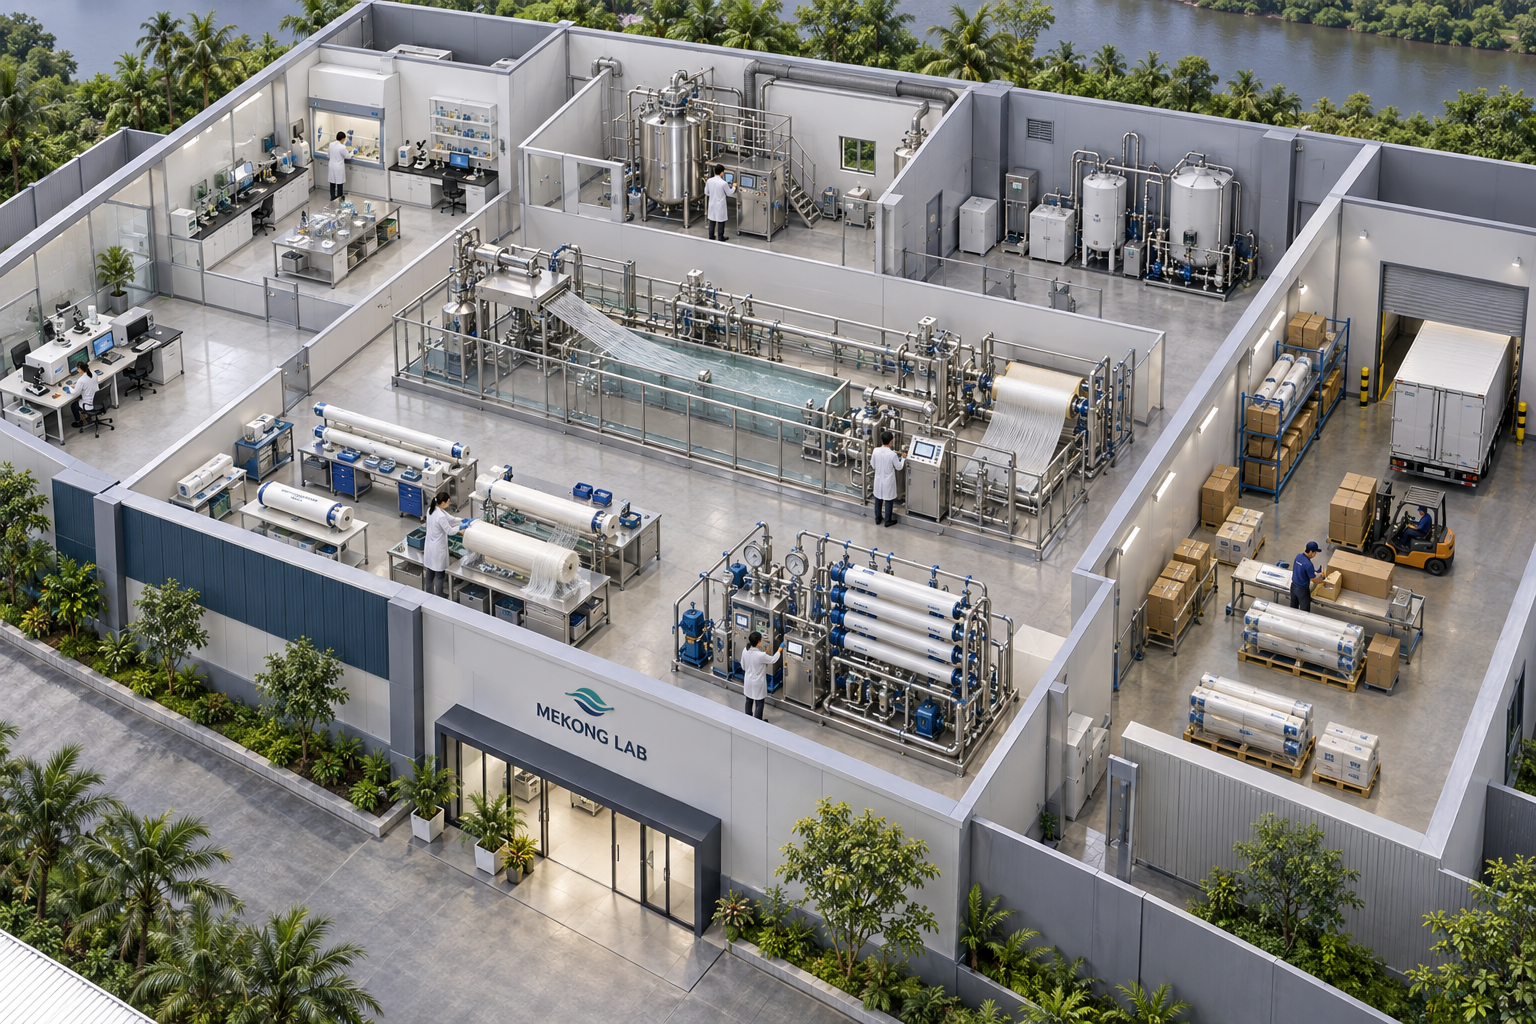
DELIVERABLE #14
Membrane technology and local production development centre
Progress through testing, assembly and feasible production stages.
07 / PROTECT · EXPLORE THE CUTAWAYS
Inside community water innovation.
Interactive concept
A serviceable system. Built around local needs.
Cut open the treatment unit and follow the water through five barriers.
13 / CUTAWAY VIEW
14 / CUTAWAY VIEW
Step 1 of 5
FOLLOW THE WATER
Select each treatment step using verified source-water results. This conceptual unit is not a certified product or a construction specification.View illustration ↗
 mekong




.jpg)